


For many years visual inspection of fundus photography [1] and examination of images acquired with optical coherence tomography (OCT) [2] have been used by ophthalmologists for eye disease diagnosis and monitoring therapy progress thanks to their ability to detect morphological changes in the retina. However, imaging the morphological manifestation of retinal diseases alone does not provide sufficient information on the loss of functionality of retinal neurons.
Over a decade ago, it was shown that optical coherence tomography (OCT) can detect small changes in the intensity of infrared light reflected from animal retinas in vitro [3,4] and in vivo [5] occurring after simultaneous stimulation with visible light. These findings laid the foundations for the development of optoretinography (ORG) [6], a method that measures photoreceptors’ response to light, thus giving a possibility for obtaining information about the functionality of retinal neurons.
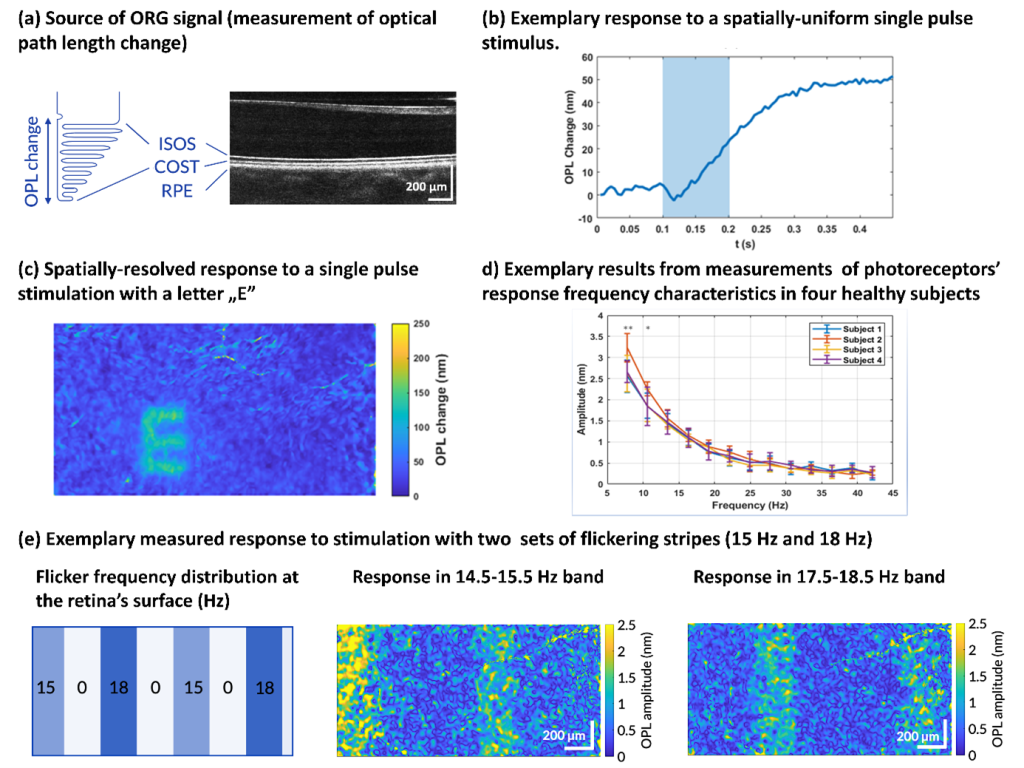
At ICTER, we work on both ORG with a single pulse and flicker stimulation of the retina [7]. To acquire the ORG data, we use a Spatio-Temporal Optical Coherence-Tomography (STOC-T) [8] that records 3-D volumetric retina images within a few milliseconds each. After data processing, we extract the ORG signals by tracking subtle changes in the retina occurring between inner and outer photoreceptor junction (IS/OS) and the cone outer segment tips (COST). Fig. (a). presents the source of the ORG signal on an exemplary tomographic image of a human retina.
Exemplary results showing dark-adapted retinas’ responses to single pulse light stimulus are shown in Fig. (b) and (c). The (b) presents a spatially averaged ORG signal in function of time for uniformly distributed stimulus. The (c) shows the maximum amplitude of the ORG signal across imaged part of the retina surface in response to a projected pattern (letter E).
In the f-ORG experiments, which are the main subject of our works, a flickering light is used to stimulate the retina. First, such a study was performed by Schmoll et al. and measured photoreceptors’ response to a 5 Hz flicker [9], while, more recently, the group from Lübeck measured the response to different flicker frequencies (between 1 Hz and 6.6 Hz) [10].
Our f-ORG methodology allows for measuring retinas’ responses in a broader range of frequencies and mapping the photoreceptors’ response to a flickering light across the retinas’ surfaces. Exemplary results of measured frequency characteristics of the responses in four healthy human subjects are presented in Fig. (d). While an example of a spatially detected retina’s response to a DMD patterned stimulus with strips of light flickering at different frequencies is presented in Fig. (e).
Text: Sławomir Tomczewski, PhD, e-mail: stomczewski@ichf.edu.pl.
Team:
Keywords: Optical Coherence Tomography, STOC-T, OCT, Optoretinography, Flicker ORG.
Publications:
- V. J. Srinivasan, M. Wojtkowski, J. G. Fujimoto, and J. S. Duker, “In vivo measurement of retinal physiology with high-speed ultrahigh-resolution optical coherence tomography,” Opt. Lett. 31, 2308 (2006).
- S. Tomczewski, P. Węgrzyn, D. Borycki, E. Auksorius, M. Wojtkowski, and A. Curatolo, “Light-adapted flicker optoretinograms captured with a spatio-temporal optical coherence-tomography (STOC-T) system,” Biomed. Opt. Express 13, 2186 (2022).
- E. Auksorius, D. Borycki, P. Wegrzyn, B. L. Sikorski, K. Lizewski, I. Zickiene, M. Rapolu, K. Adomavicius, S. Tomczewski, and M. Wojtkowski, “Spatio-Temporal Optical Coherence Tomography provides full thickness imaging of the chorioretinal complex,” iScience 25, 105513 (2022).


