31.10.2023

IDoc Group achievements in 3 years perspective

One of the primary initiatives within the IDoc Group focuses on the development of safer and more effective tools for eye surgery. This endeavor posed a distinct challenge for us, as it fell outside our traditional areas of expertise. Nevertheless, it is indeed a remarkable achievement that we have managed to assemble a team that, in under three years, has successfully amalgamated diverse expertise and advanced the project to its current stage. Our journey was marked by a gradual accumulation of knowledge and experience, ultimately culminating in the integration of all the components.

We are now pleased to inform you of the initial experiments where a robotic manipulator has been deployed to enhance manual ophthalmic surgical procedures. These innovations are complemented by the integration of Optical Coherence Tomography (OCT) images, meticulously aligned with the surgical tools’ tip precise position.

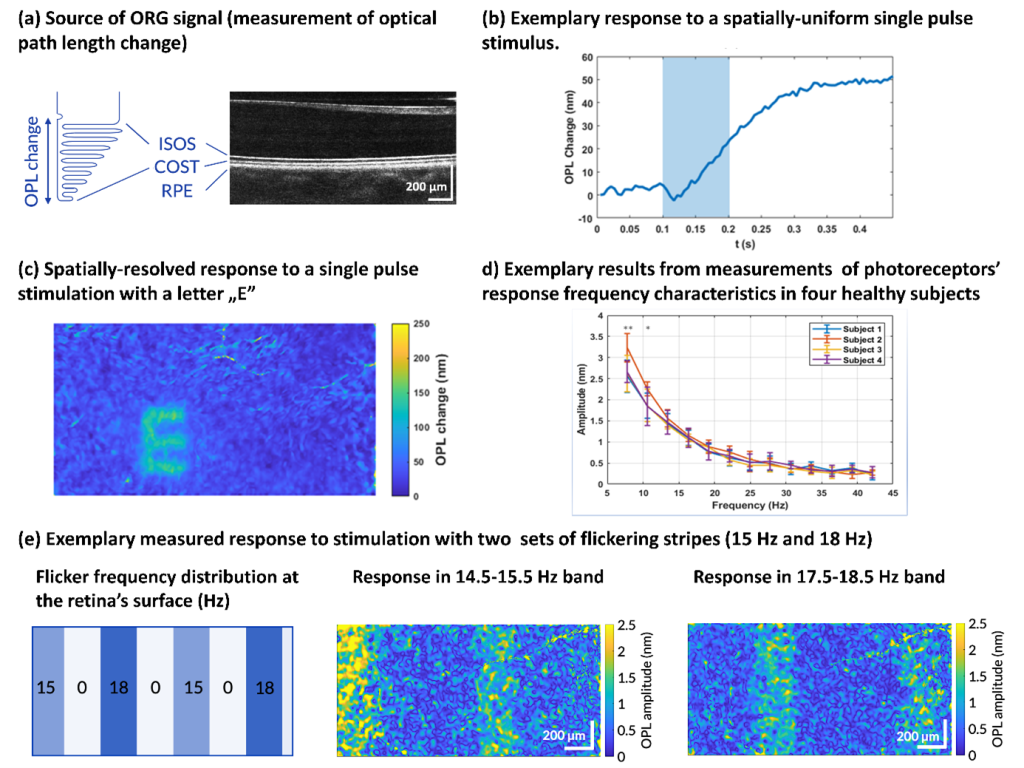
Another project the IDoc laboratory has been involved in goes to the very core of what the ICTER research centre aims to develop, that is methods and instrumentation to detect proper eye structure and function and their alteration in case of disease in an objective way. We did so in collaboration with the POB lab, by pioneering a technique called optoretinography. We are combining this with structural biology tools from the ISB lab for analysing the cellular machinery and its complex changes during the visual cycle in order to validate our hypotheses about what process the functional signal we measure originates from. To do so we are validating our functional imaging results with electrophysiology methods together with OBi laboratory. 

It has been a challenging and ambitious project so far, but its collaborative nature made it all the more rewarding when not long ago we observed, in a repeatable way and for the first time, reduced functional responses from mice subject to temporal inhibition of vision, compared to their response only a couple of hours before the pharmacological treatment. We were able to objectively show with optoretinography that when a central protein (from the PDE family) involved in the phototransduction is inhibited, the mouse retinal photoreceptors, when exposed to a short flash of light, do not elongate nearly as much as they do when the mouse eye is fully functional. Measuring such a small physical change on photoreceptor length in vivo, as we are talking of only few tens of nanometers, can have a huge impact on vision science and ophthalmology by providing an objective functional test of visual ability and photoreceptor health. This in turns can speed up therapy selection and efficacy studies.

We look forward to upcoming results in this field.

Authors:

Dr. Karol Karnowski & Dr. Andrea Curatolo

28.08.2023

Diffuse optics and interferometry

Diffuse optics offers a noninvasive portable approach for examining biological tissues, including the human brain, in vivo [1]. Near-infrared spectroscopy (NIRS) [2] and diffuse correlation spectroscopy (DCS) are the primary diffuse optical modalities [3, 4]. In both approaches, the light illuminates the tissue, and diffusively scattered photons are collected at some distance from the emitter (typically 2-3 cm). NIRS uses the detected signal to estimate optical properties (absorption and scattering), while DCS quantifies the blood flow from temporal changes of the remitted light intensity. Although these methods have been applied to monitor brain oxygenation and blood flow, their most widely adopted versions rely on continuous wavelength (CW) lasers, precluding absolute measures of the optical and dynamical tissue properties [5].

Time-domain NIRS (TD-NIRS) enables quantification of the optical properties through the sample’s photon time-of-flight distribution (TOF distribution) [9-12]. This capability can also be combined with correlation spectroscopy to achieve TOF- (or photon path-length-) resolved blood flow information. So, we could better distinguish photons traversing superficial layers (short TOFs) from photons traveling deep into the brain (long TOFs). Also, given the TOF distribution, we could estimate the optical properties to achieve the absolute blood flow index (BFI), effectively combining the capabilities of TD-NIRS with DCS into a single modality. Such an approach is called time-domain diffuse correlation spectroscopy (TD-DCS) [6, 7].

Though TD-DCS is a powerful technique even applied in clinics, it relies only on light intensity. Therefore, TD-DCS does not enable the detection of the optical phase [8]. The optical phase is accessible in interferometric near-infrared spectroscopy (iNIRS) [9].

Interferometry in brain monitoring

Image: Interferometry in brain monitoring.

The optical phase is accessible in interferometric near-infrared spectroscopy (iNIRS). The iNIRS approach uses interferometry based on a temporally coherent tunable laser to achieve TOF resolution. Specifically, iNIRS supplements the conventional NIRS configuration with the tunable light source and the reference arm. The field remitted from the sample is recombined with the reference field. The beat frequency of the signal encodes photon path lengths (or times-of-flight). Short paths produce lower beat frequencies than long paths. Consequently, the photon time-of-flight distribution can be achieved by inverse-Fourier transforming the recorded signal. However, iNIRS provides much more information through the two-dimensional autocorrelation function (ACF) of the reemitted optical field. In iNIRS, the ACF is measured as a function of time lag with TOF resolution. This two-dimensional measurement (figure below) encodes information about the sample’s absorption, scattering, and blood flow index (BFI).

iNIRS was validated in in liquid phantoms [9], mouse brain [10], and human brain in vivo [11]. However, the original iNIRS (as DCS and TD-DCS) uses single-mode fibers for light collection, requiring integration times of 0.5-1 second. This time frame is too long, precluding the ability to detect rapid blood flow changes in the human brain that could be linked to neural signals.

To overcome those limitations, we recently proposed parallel interferometric near-infrared spectroscopy (πNIRS). In πNIRS we use multi-mode fibers for light collection and a high-speed, two-dimensional camera for light detection. Each camera pixel acts effectively as a single iNIRS channel. So, the processed signals from each pixel are spatially averaged to reduce the overall integration time. Moreover, interferometric detection provides us with the unique capability of accessing complex information (amplitude and phase) about the light remitted from the sample, which with more than 8000 parallel channels, enabled us to sense the cerebral blood flow with only a 10 msec integration time (∼100x faster than conventional iNIRS). We used such an approach to monitor the pulsatile blood flow in a human forearm in vivo. Also, we demonstrated that this approach could monitor the activation of the prefrontal cortex by recording the change in blood flow in the forehead of the subject while he was reading an unknown text [12].

Text: Dawid Borycki, PhD habil.

Team:

Dawid Borycki, PhD habil.

Michał Dąbrowski, PhD

Klaudia Nowacka, MEng

References:

  1. S. Samaei, P. Sawosz, M. Kacprzak, Z. Pastuszak, D. Borycki, and A. Liebert, “Time-domain diffuse correlation spectroscopy (TD-DCS) for noninvasive, depth-dependent blood flow quantification in human tissue in vivo,” Sci Rep 11, 1817 (2021).
  2. D. Borycki, O. Kholiqov, and V. J. Srinivasan, “Interferometric near-infrared spectroscopy directly quantifies optical field dynamics in turbid media,” Optica 3, 1471-1476 (2016).
  3. D. Borycki, O. Kholiqov, S. P. Chong, and V. J. Srinivasan, “Interferometric Near-Infrared Spectroscopy (iNIRS) for determination of optical and dynamical properties of turbid media,” Opt Express 24, 329-354 (2016).
  4. D. Borycki, O. Kholiqov, and V. J. Srinivasan, “Reflectance-mode interferometric near-infrared spectroscopy quantifies brain absorption, scattering, and blood flow index in vivo,” Opt Lett 42, 591-594 (2017).
  5. S. Samaei, K. Nowacka, A. Gerega, Z. Pastuszak, and D. Borycki, “Continuous-wave parallel interferometric near-infrared spectroscopy (CW piNIRS) with a fast two-dimensional camera,” Biomed Opt Express 13, 5753-5774 (2022).
16.08.2023

A new paper by IDoc group researchers, international scientists and a spin-off company published in “Biomedical Optics Express”

Whole-eye optical coherence tomography (OCT) imaging is a promising tool in ocular biometry for cataract surgery planning, glaucoma diagnostics and myopia progression studies. However, conventional OCT systems are set up to perform either anterior or posterior eye segment scans and cannot easily switch between the two scan configurations without adding or exchanging optical components to account for the refraction of the eye’s optics. In this work, we present the design, optimization and experimental validation of a reconfigurable and low-cost optical beam scanner based on three electro-tunable lenses, capable of non-mechanically controlling the beam position, angle and focus. The proposed beam scanner reduces the complexity and cost of other whole-eye scanners and is well suited for 2-D ocular biometry. Additionally, with the added versatility of seamless scan reconfiguration, its use can be easily expanded to other ophthalmic applications and beyond.

Text: Dr. Andrea Curatolo – Principal Investigator in the IDoc group at ICTER.

Publication:

María Pilar Urizar, Enrique Gambra, Alberto de Castro, Álvaro de la Peña, Onur Cetinkaya, Susana Marcos, and Andrea Curatolo, “Optical beam scanner with reconfigurable non-mechanical control of beam position, angle, and focus for low-cost whole-eye OCT imaging,” Biomed. Opt. Express 14, 4468-4484 (2023)

Link: https://opg.optica.org/boe/fulltext.cfm?uri=boe-14-9-4468&id=535917

22.06.2023

Droplet microfluidics systems

Microfluidic droplet systems allow the manipulation of small volumes of liquids with two immiscible phases, such as water and oil. The result is a small reactor in which a chemical reaction or biological process can be carried out and observed over time. The microdroplets can be mixed, sorted, incubated, and analyzed. These operations can be performed in specially designed microfluidic systems, creating a small lab-on-a-chip device. The main goal of our research is to observe the behavior of clinically relevant bacterial strains, particularly how they respond to antibiotics. Optics and laser technology combined with microfluidic systems allow us to conduct experiments much faster.

Antimicrobial resistance (AMR) is one of the world’s most pressing health threats. It occurs when bacteria, viruses, fungi, and parasites transform over time and no longer respond to drugs. As a result, antibiotics or other antimicrobial drugs become ineffective and fail to treat diseases. The World Health Organization (WHO) has identified AMR as one of the top 10 public health threats worldwide.

Monitoring the behavior of bacteria, i.e., their growth, is complex and time-consuming, especially when we have to keep track of thousands or millions of repeat experiments. Optical methods combined with microfluidics allow us to solve this problem. We can move droplets in front of a laser beam and analyze the light scattered on bacterial cells using specially designed chips. The intensity of the scattered light is related to the concentration of bacteria in the droplets, and we can track it over time. We can monitor over 1,000 droplets per second and analyze them with dedicated software. In addition, we can make the system more compact and easier to use by using fiber optics; we proposed a system in which a specially selected optical fiber is used to collect the light scattered on the bacteria [1].

Still, severe non-healing infections are often caused by multiple pathogens or genetic variants of the same pathogen exhibiting different levels of antibiotic resistance. For example, polymicrobial diabetic foot infections double the risk of amputation compared to monomicrobial infections. Although these infections lead to increased morbidity and mortality, standard antimicrobial susceptibility methods are designed for homogenous samples and are impaired in quantifying heteroresistance. We propose a droplet-based label-free method for quantifying the antibiotic response of the entire population at the single-cell level. We used Pseudomonas aeruginosa and Staphylococcus aureus samples to confirm that the shape of the profile informs about the coexistence of diverse bacterial subpopulations, their sizes, and antibiotic heteroresistance. These profiles could therefore indicate the outcome of antibiotic treatment in terms of the size of remaining subpopulations [2].

Author: Jakub Bogusławski, PhD

Team:

Jakub Bogusławski, PhD jboguslawski@ichf.edu.pl

Kamil Liżewski, PhD klizewski@ichf.edu.pl

Prof. Maciej Wojtkowski mwojtkowski@ichf.edu.pl

Publications:

  1. Natalia Pacocha, Jakub Bogusławski, Michał Horka, Karol Makuch, Kamil Liżewski, Maciej Wojtkowski, Piotr Garstecki, „High-Throughput Monitoring of Bacterial Cell Density in Nanoliter Droplets: Label-Free Detection of Unmodified Gram-Positive and Gram-Negative Bacteria,” Analytical Chemistry (2020).
  2. Natalia Pacocha, Marta Zapotoczna, Karol Makuch, Jakub Bogusławski, Piotr Garstecki, “You will know by its tail: a method for quantification of heterogeneity of bacterial populations using single-cell MIC profiling,” Lab on a Chip 22, 4317-4326 (2022).

20.06.2023

Flicker Optoretinography (f-ORG)

For many years visual inspection of fundus photography [1] and examination of images acquired with optical coherence tomography (OCT) [2] have been used by ophthalmologists for eye disease diagnosis and monitoring therapy progress thanks to their ability to detect morphological changes in the retina. However, imaging the morphological manifestation of retinal diseases alone does not provide sufficient information on the loss of functionality of retinal neurons.

Over a decade ago, it was shown that optical coherence tomography (OCT) can detect small changes in the intensity of infrared light reflected from animal retinas in vitro [3,4] and in vivo [5] occurring after simultaneous stimulation with visible light. These findings laid the foundations for the development of optoretinography (ORG) [6], a method that measures photoreceptors’ response to light, thus giving a possibility for obtaining information about the functionality of retinal neurons.

At ICTER, we work on both ORG with a single pulse and flicker stimulation of the retina [7]. To acquire the ORG data, we use a Spatio-Temporal Optical Coherence-Tomography (STOC-T) [8] that records 3-D volumetric retina images within a few milliseconds each. After data processing, we extract the ORG signals by tracking subtle changes in the retina occurring between inner and outer photoreceptor junction (IS/OS) and the cone outer segment tips (COST). Fig. (a). presents the source of the ORG signal on an exemplary tomographic image of a human retina.

Exemplary results showing dark-adapted retinas’ responses to single pulse light stimulus are shown in Fig. (b) and (c). The (b) presents a spatially averaged ORG signal in function of time for uniformly distributed stimulus. The (c) shows the maximum amplitude of the ORG signal across imaged part of the retina surface in response to a projected pattern (letter E).

In the f-ORG experiments, which are the main subject of our works, a flickering light is used to stimulate the retina. First, such a study was performed by Schmoll et al. and measured photoreceptors’ response to a 5 Hz flicker [9], while, more recently, the group from Lübeck measured the response to different flicker frequencies (between 1 Hz and 6.6 Hz) [10].

Our f-ORG methodology allows for measuring retinas’ responses in a broader range of frequencies and mapping the photoreceptors’ response to a flickering light across the retinas’ surfaces. Exemplary results of measured frequency characteristics of the responses in four healthy human subjects are presented in Fig. (d). While an example of a spatially detected retina’s response to a DMD patterned stimulus with strips of light flickering at different frequencies is presented in Fig. (e).

Text: Sławomir Tomczewski, PhD, e-mail: stomczewski@ichf.edu.pl.

Team:

Sławomir Tomczewski, PhD

Piotr Węgrzyn, MSc

Dawid Borycki, PhD habil.

Egidijus Auksorius, PhD

Maciej Wielgo, MSc

Prof. Maciej Wojtkowski

Andrea Curatolo, PhD

Keywords: Optical Coherence Tomography, STOC-T, OCT, Optoretinography, Flicker ORG.

Publications:

  1. V. J. Srinivasan, M. Wojtkowski, J. G. Fujimoto, and J. S. Duker, “In vivo measurement of retinal physiology with high-speed ultrahigh-resolution optical coherence tomography,” Opt. Lett. 31, 2308 (2006).
  2. S. Tomczewski, P. Węgrzyn, D. Borycki, E. Auksorius, M. Wojtkowski, and A. Curatolo, “Light-adapted flicker optoretinograms captured with a spatio-temporal optical coherence-tomography (STOC-T) system,” Biomed. Opt. Express 13, 2186 (2022).
  3. E. Auksorius, D. Borycki, P. Wegrzyn, B. L. Sikorski, K. Lizewski, I. Zickiene, M. Rapolu, K. Adomavicius, S. Tomczewski, and M. Wojtkowski, “Spatio-Temporal Optical Coherence Tomography provides full thickness imaging of the chorioretinal complex,” iScience 25, 105513 (2022).
15.06.2023

Two-Photon Excited-Fluorescence Scanning Laser Ophthalmoscope (TPEF-SLO)

The ability to noninvasively access metabolic processes during the visual cycle is crucial for developing therapies against retinal degenerative diseases. We have developed a protocol for obtaining in vivo two-photon excited fluorescence images of the fundus in the human eye.

The visual cycle is a series of chemical transformations during which various fluorescent intermediates are formed. Blue-induced fundus autofluorescence allows visualization of retinal fluorophores. However, due to fundamental limitations, this method is limited to imaging lipofuscin, which contains byproducts of the visual cycle but does not directly reflect changes in photoreceptor function. The absorption spectra of fluorophores participating in the visual cycle, such as retinyl esters, lie in the UV spectral range. However, absorption and scattering in the front of the eye, as well as safety concerns, exclude UV from applications in ophthalmic imaging.

Two-photon excitation allows us to bypass this limitation and excite previously unavailable fluorophores, creating novel diagnostic capabilities. Retinal fluorophores can be excited with minimal absorption and much lower scattering and phototoxicity using femtosecond pulses at near-infrared wavelengths. Previously, we have shown imaging with a two-photon excited fluorescence scanning laser ophthalmoscope (TPEF-SLO) proved to be very useful in mice. Recently, in 2022 we report for the first time in vivo imaging of the human eye using a two-photon excited fluorescence (TPEF) with near-infrared light. We have built a compact instrument based on scanning laser ophthalmoscope (SLO) with a custom femtosecond fiber-based laser and efficient photon detection, and designed advanced data post-processing that enabled measurement of TPEF signals on the sub-single photon level. As a result, we can visualize the distribution of retinal fluorophores with exposure far below the safety limits for the human eye.

We heave measured dozens of volunteers to confirm the robustness of the technique and extend the experimental setup to work with mice models to investigate different eye diseases, like age-related or Stargardt macular degeneration. Imaging was performed in a dark room with no prior dark adaptation or pupil dilation. We were able to record the fluorescence signal and reconstruct the image in the majority of cases.  This technique allays safety concerns by allowing for the acquisition of informative images at low laser exposure. We confirmed the applicability of the system for future clinical use of this imaging modality. These results constitute an essential step towards functional imaging of the human eye that directly reflects local changes in the retina’s function.

Author: Michał Dąbrowski, PhD

Figure 1: a Example TPEF images of the human retina with different spectra filter on PMT detector.      b The same but for mice retina. c Comparison of fluorescence signal intensity for different spectra filter both for humans and several mice models. d FLIM images along with phasor plot representations.
Figure 1: a Example TPEF images of the human retina with different spectra filter on PMT detector. b The same but for mice retina. c Comparison of fluorescence signal intensity for different spectra filter both for humans and several mice models. d FLIM images along with phasor plot representations

Team:

Michał Dąbrowski, PhD

Sławomir Tomczewski, PhD

Agata Kotulska, PhD

Marcin J. Marzejon, PhD

Jakub Bogusławski, PhD

Prof. Maciej Wojtkowski

Publications:

  1. G. Palczewska, J. Boguslawski, P. Stremplewski, Ł. Kornaszewski, J. Zhang, Z. Dong, X.-X. Liang, E. Gratton, A. Vogel, M. Wojtkowski, and K. Palczewski, Noninvasive two-photon optical biopsy of retinal fluorophores, Proc. Natl. Acad. Sci. U. S. A 117, 22532 (2020)
  2. D. Stachowiak, J. Bogusławski, A. Głuszek, Z. Łaszczych, M. Wojtkowski, and G. Soboń, “Frequency-doubled femtosecond Er-doped fiber laser for two-photon excited fluorescence imaging, Biomed. Opt. Express 11, 4431 (2020)
  3. J. Boguslawski, G. Palczewska, S. Tomczewski, J. Milkiewicz, P.Kasprzycki, D. Stachowiak, K. Komar, M. J. Marzejon, B. L. Sikorski, A. Hudzikowski, A. Głuszek, Z. Łaszczych, K. Karnowski, G. Soboń, K. Palczewski, and M. Wojtkowski, In vivo imaginh of the human eye using a 2-photon-excited fluorescence scanning laser ophthalmoscope, JCI 132, 154218 (2022)
  4. J. Bogusławski, S. Tomczewski, M. Dąbrowski, K. Komar, J. Milkiewicz, G. Palczewska, K. Palczewski, and M. Wojtkowski, In vivo imaging of the muna retina using a two-photon excited fluorescence ophthalmoscope, STAR Protocols 4, 102225 (2023)
  5. G. Palczewska, M. Wojtkowski, and K. Palczewski, From mouse to human: Accessing the biochemistry of vision in vivo by two-photon excitation, Prog. Retin. Eye Res. 93, 101170 (2023)
09.06.2023

Two-photon optical biopsy of the retina

The retina is an important part of the eye, as it converts light into electrical signals that are later processed in the brain. It acts as a biological photodetector. Imaging the structure and function of the living retina is crucial for effectively diagnosing and treating eye diseases and drug development. Structural information about the retina can be obtained through OCT studies, among others. However, functional changes are the first signs of early pathological processes and often precede structural changes; obtaining this information is currently very difficult. ICTER researchers are working on a new method for functional imaging of the fundus based on two-photon excited fluorescence.

The retina has a layered structure that is filled with various fluorophores. For example, the retinal pigment epithelium (RPE) contains lipofuscin, a byproduct of the visual cycle. Lipofuscin accumulates with age but also as the disease progresses. Other examples include retinol and retinyl esters (vitamin A derivatives active in the visual cycle), melanin, FAD, NADH, collagen, and elastin. These substances can provide valuable information about the retina’s health and can be a valuable tool for detecting functional changes in age-related macular degeneration, diabetic retinopathy, or glaucoma.

Standard ocular autofluorescence imaging visualizes the distribution of retinal fluorophores, but only intensity information is available. As a result, signals from different fluorophores cannot be distinguished. Lipofuscin is the dominant fluorophore, and its strong signal is mixed with others, usually from much weaker sources. Different fluorophores differ in their fluorescence properties, i.e., fluorescence lifetime and fluorescence spectrum. This provides an additional discriminating parameter to distinguish them from each other.

The eye is a window to the world but has a certain transmission range. Consequently, many fluorophores with excitation spectra in the UV/blue range (<420 nm) cannot be excited, and the information they contain is unavailable. Our solution to this problem is to use two-photon excitation. This scheme uses short (femtosecond) pulses in the near-infrared (twice the wavelength), which bypasses the limitations due to the transmission of the eye. For example, the use of femtosecond pulses at 730 nm is equivalent to single-photon excitation at 365 nm, which would not be possible in the living eye. Additional advantages of this method include better resolution, less phototoxicity, and less scattering.

In our research, we aim to visualize eye tissue structure and molecular composition using spectral and temporal discrimination. For example, the image below shows the fluorescence lifetime distribution (FLIM) of retinal pigment epithelial cells of Abca4PV/PV mice (a model of Stargardt disease in humans). The image reflects differences in the pigment epithelium’s subcellular distribution of endogenous fluorophores. Shorter lifetimes (blue-green color) are associated with A2E, a component of lipofuscin. Red granules (longer lifetimes) may be associated with retinyl esters.

Author: Jakub Bogusławski, PhD jboguslawski@ichf.edu.pl

Team: Grażyna Palczewska, Jakub Bogusławski, Łukasz Kornaszewski, Maciej Wojtkowski

Publication:

Grazyna Palczewska, Jakub Boguslawski, Patrycjusz Stremplewski, Lukasz Kornaszewski, Jianye Zhang, Zhiqian Dong, Xiao-Xuan Liang, Enrico Gratton, Alfred Vogel, Maciej Wojtkowski, Krzysztof Palczewski, “Noninvasive two-photon optical biopsy of retinal fluorophores,” Proceedings of the National Academy of Sciences 117(36), 22532-22543 (2020).

06.06.2023

Two-photon vision

Vision allows for receiving stimuli from the surrounding world through electromagnetic waves from 400 to 780 nm, called visible light. It begins when a photon of such light is absorbed by the visual pigment of the photoreceptor in the light-sensitive part of the eye – the retina. Absorption of a photon initiates a series of biochemical reactions, as a result of which light is converted into an electrical signal, which is later processed in the brain.

Two-photon vision relies on the two-photon absorption occurring in visual pigments upon irradiation by ultrashort near-infrared lasers. The visual system reacts as if one photon of light is absorbed in the photoreceptors, while two photons of infrared radiation of twice the lower energy are absorbed. The observer perceives the stimulus as if it had a color corresponding to about half the excitation wavelength of the infrared laser beam.

Two-photon vision has several interesting properties different from “normal” one-photon vision. First, it occurs for a different spectral range: from about 800 nm to 1300 nm – for these wavelengths; the color impression changes from blue, green, yellow, and finally, red. Second, the brightness of a two-photon stimulus varies quadratically with the power of optical radiation, so light scattered in the eye will not be perceived. Brightness also depends on the beam’s focus on the observer’s retina. Observed stimuli have better contrast and sharpness than “normal” one-photon vision.

At the International Centre for Translational Eye Research, we study the phenomenon of two-photon vision – we discover its properties and describe them for the first time. We are also looking for applications of this phenomenon in medical diagnostics (e.g., two-photon microperimetry) and visualization systems (virtual retinal displays).

Two-photon microperimetry

The conventional approach to visual field testing is based on displaying visible stimuli at various locations on the patient’s retina and recording their response. Unfortunately, the accuracy and reproducibility of classical visual field testing methods are limited. Moreover, we cannot use it in cases of patients with opacities of the eye media (e.g., cataracts).

Two-photon microperimetry, a new diagnostic technique that uses pulsed infrared beams to stimulate the retina of the subject, may be the answer to these challenges. Such stimuli are perceived through the process of two-photon vision. The use of two-photon perception for visual field testing has several advantages. Unlike visible light, infrared radiation is less scattered on the opacities of the eye’s optical medium. In addition, two-photon vision is a nonlinear optical process, resulting in smaller spread of visual threshold values compared to classical microperimetry. This translates into better reproducibility of the visual field examination.

At the International Centre for Translational Eye Research, we are developing the technique of two-photon microperimetry, including studying the effects of different parameters of pulsed laser sources – wavelength, pulse length and repetition rate – on the efficiency of retinal stimulation.

Authors: Katarzyna Komar, PhD and Marcin Marzejon, PhD

Team:

Katarzyna Komar, PhD

Marcin Marzejon, PhD

Oliwia Kaczkoś, MSc

Agata Kotulska, PhD

Prof. Maciej Wojtkowski

Publications:

  1. G. Palczewska, F. Vinberg, P. Stremplewski, M. P. Bircher, D. Salom, K. Komar, J. Zhang, M. Cascella, M. Wojtkowski, V. J. Kefalov, and K. Palczewski, “Human infrared vision is triggered by two-photon chromophore isomerization,” Proc. Natl. Acad. Sci. U. S. A. 111(50), E5445–E5454 (2014).
  2. D. Ruminski, G. Palczewska, M. Nowakowski, V. Kefalov, K. Komar, K. Palczewski, and M. Wojtkowski, “Two-photon microperimetry: sensitivity of human photoreceptors to infrared light,” Biomed. Opt. Express 10(9), 4551–4567 (2019).
  3. G. Łabuz, A. Rayamajhi, J. Usinger, K. Komar, P. Merz, R. Khoramnia, G. Palczewska, K. Palczewski, and G. U. Auffarth, “Clinical application of infrared-light microperimetry in the assessment of scotopic-eye sensitivity,” Transl. Vis. Sci. Technol. 9(8), 1–9 (2020).
  4. M. J. Marzejon, Ł. Kornaszewski, J. Bogusławski, P. Ciąćka, M. Martynow, G. Palczewska, S. Maćkowski, K. Palczewski, M. Wojtkowski, and K. Komar, “Two-photon microperimetry with picosecond pulses,” Biomed. Opt. Express 12(1), 462–479 (2021).
  5. M. Marzejon, Ł. Kornaszewski, M. Wojtkowski, and K. Komar, “Effects of laser pulse duration in two-photon vision threshold measurements,” in Ophthalmic Technologies XXXI, D. X. Hammer, K. M. Joos, and D. V Palanker, eds. (SPIE, 2021), 11623, pp. 74–79
  6. G. Łabuz, A. Rayamajhi, R. Khoramnia, G. Palczewska, K. Palczewski, A. Holschbach, and G. U. Auffarth, “The loss of infrared-light sensitivity of photoreceptor cells measured with two-photon excitation as an indicator of diabetic retinopathy: A pilot study,” Retina 41(6), 1302–1308 (2021).
  7. D. Stachowiak, M. Marzejon, J. Bogusławski, Z. Łaszczych, K. Komar, M. Wojtkowski, and G. Soboń, “Femtosecond Er-doped fiber laser source tunable from 872 to 1075 nm for two-photon vision studies in humans,” Biomed. Opt. Express 13(4), 1899–1911 (2022).
  8. A. Zielińska, P. Ciąćka, M. Szkulmowski, and K. Komar, “Pupillary Light Reflex Induced by Two-Photon Vision,” Investig. Opthalmology Vis. Sci. 62(15), 23 (2021).
  9. M. J. Marzejon, “Two-photon perimetry utilizing picosecond lasers,” Gdańsk University of Technology (2022).
  10. O. Kaczkoś, A. Zielińska, M. J. Marzejon, J. Solarz-Niesłuchowski, J. Pniewski, K. Komar, “Methods of determining the contrast sensitivity function for two-photon vision,” Proc. SPIE 12502, 1250215 (2022).
  11. G. Łabuz, A. Rayamajhi, K. Komar, R. Khoramnia, and G. U. Auffarth, “Infrared- and white-light retinal sensitivity in glaucomatous neuropathy,” Sci. Rep. 12(1), 1961 (2022).
  12. M. J. Marzejon, PhD thesis “Two-photon perimetry utilizing picosecond lasers”, Gdańsk University of Technology (2022).
  13. D. Stachowiak, M. Marzejon, J. Bogusławski, Z. Łaszczych, K. Komar, M. Wojtkowski, and G. Soboń, “Femtosecond Er-doped fiber laser source tunable from 872 to 1075 nm for two-photon vision studies in humans,” Biomed. Opt. Express 13(4), 1899–1911 (2022).
  14. M. J. Marzejon, Ł. Kornaszewski, M. Wojtkowski, and K. Komar, “Laser pulse train parameters determine the brightness of a two-photon stimulus”,  Biomed. Opt. Express 14(4), 2857-2872 (2023).